B2B Website Growth Strategy (How to Turn Your Site Into a Growth System)
Iftikhar Ahmad Khan
Co-Founder & Content Strategist
Key Takeaways
Website growth depends on attracting qualified visitors, converting their interest and turning new customers into lasting ones.
Diagnose where growth is stalling before choosing a fix. More traffic isn't always the answer.
Give every page one clear primary job. Attract, convert or prove.
Prioritize improvements based on potential impact, available evidence and effort.
Build repeatable growth loops where each cycle creates insights and assets that make the next one stronger.
Picture a B2B SaaS company whose demo requests have been flat for two quarters. Marketing proposes more content, design proposes a redesign, and the product team wants an A/B testing tool.
Each idea is reasonable and each of them addresses the problem the company actually has.
Start by finding the constraint, then choose the fix.
This article shows you how to diagnose the problem, give each page a primary job and prioritize changes using evidence.
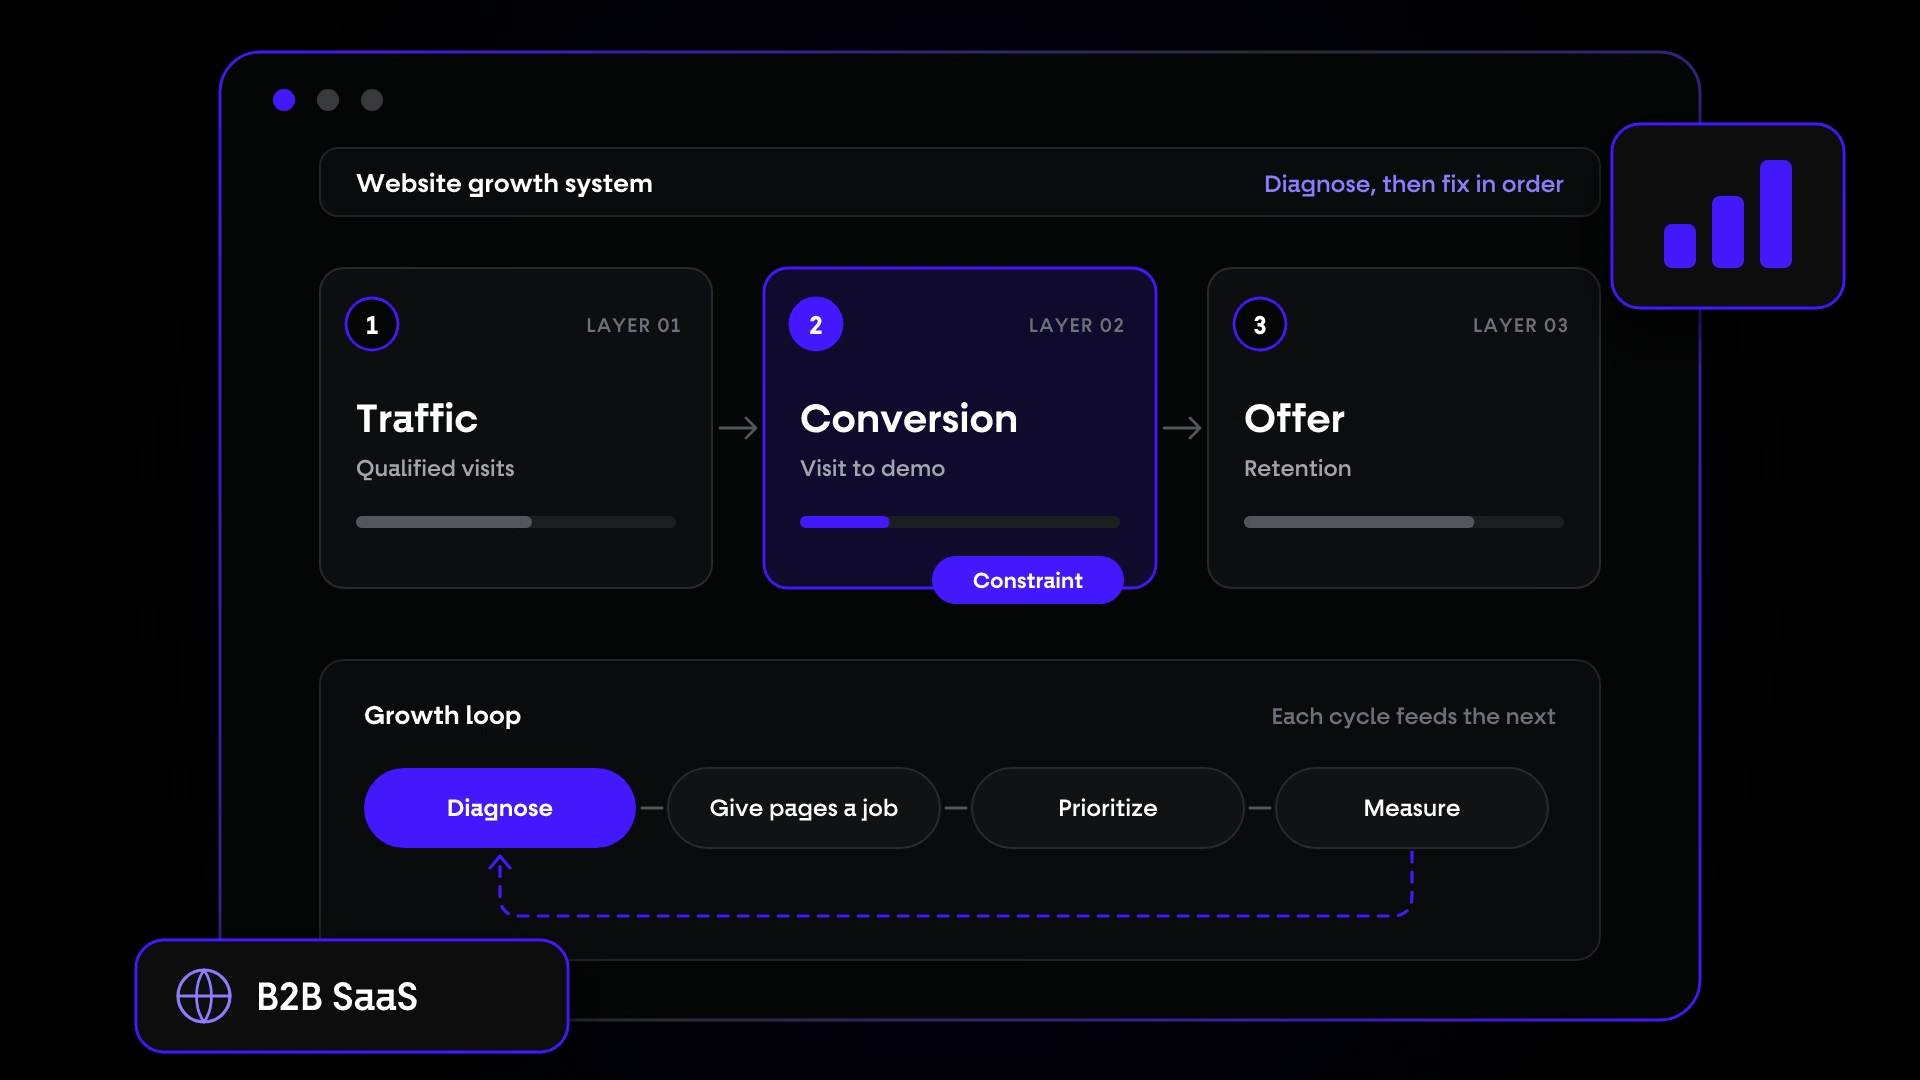
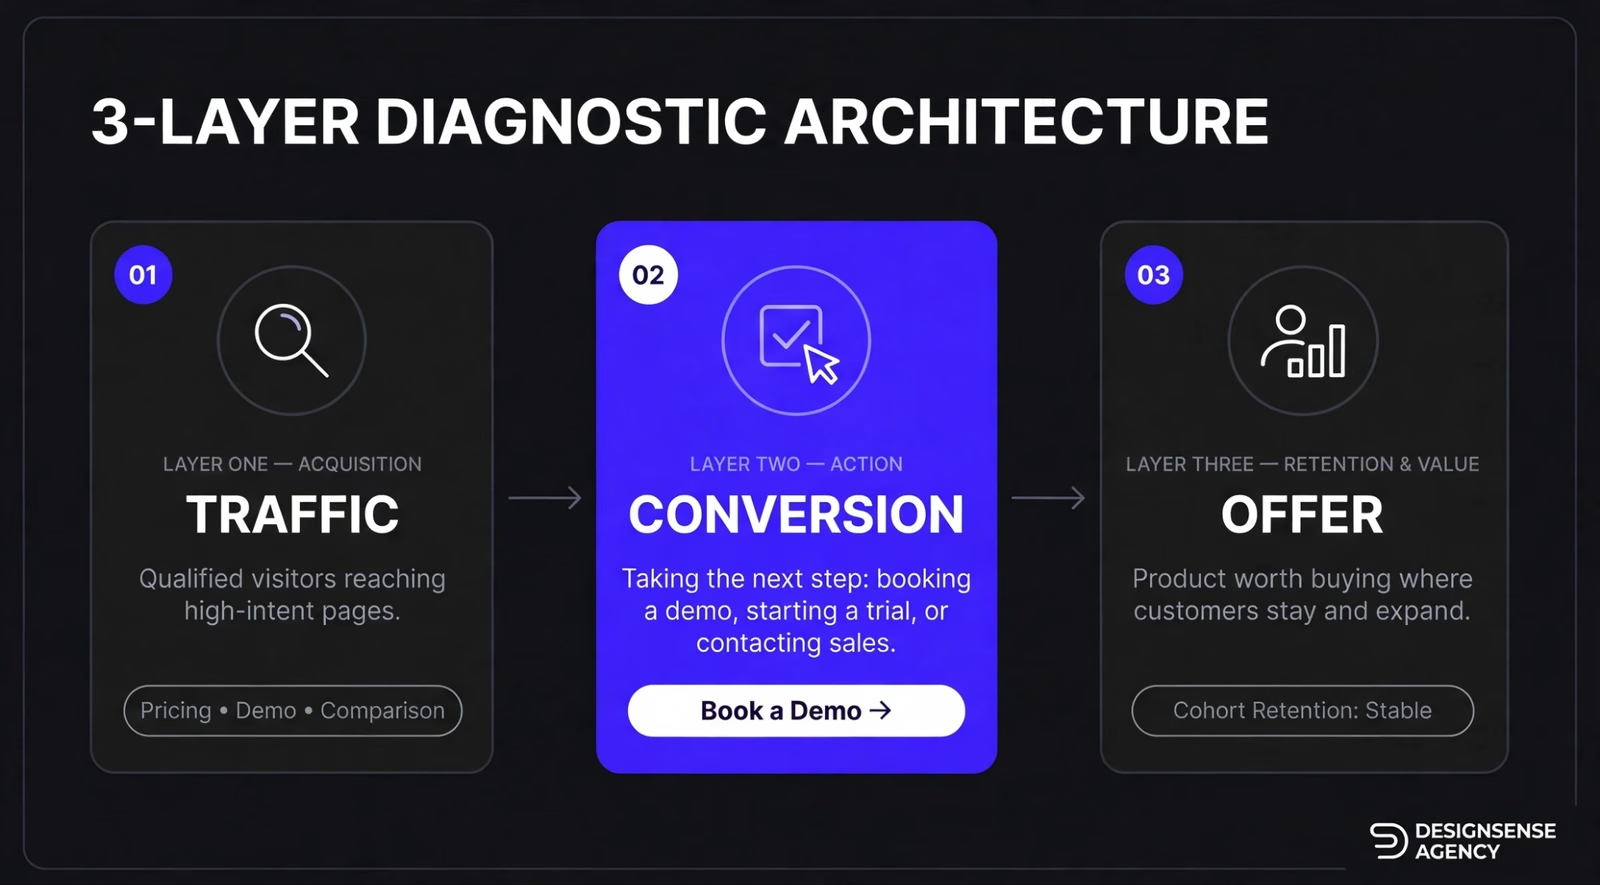
A useful starting point is to look at three connected layers of the website and the business around it.
Traffic: The right people reach the pages that matter.
Conversion: When they arrive, they take the next step, such as booking a demo, starting a trial or contacting sales.
Offer: What they find is worth buying and the customers who buy it stay.
These layers affect one another, so the symptoms can be misleading.
More traffic will not solve a page that gives qualified visitors no reason to act. A cleaner design will not fix a product customers abandon and weak conversion can reflect the wrong audience or a weak offer, not just a page problem.
Teams tend to reach for the layer they own.
The 2018 Reforge series by Brian Balfour, Casey Winters, Kevin Kwok and Andrew Chen describes how the funnel splits companies along these lines.
Marketing owns acquisition, product owns retention, sales owns revenue and each team optimizes its own number, sometimes at the expense of the others.
For example, marketing brings in low-quality leads to hit a target, which then drags down every metric further down the line.
The layers overlap.
Visitors from the wrong audience can make a page look weak. A weak offer can do the same.
Treat the model as a diagnostic sequence, not three sealed boxes. The goal is to find the strongest constraint first, then check whether other problems are contributing.
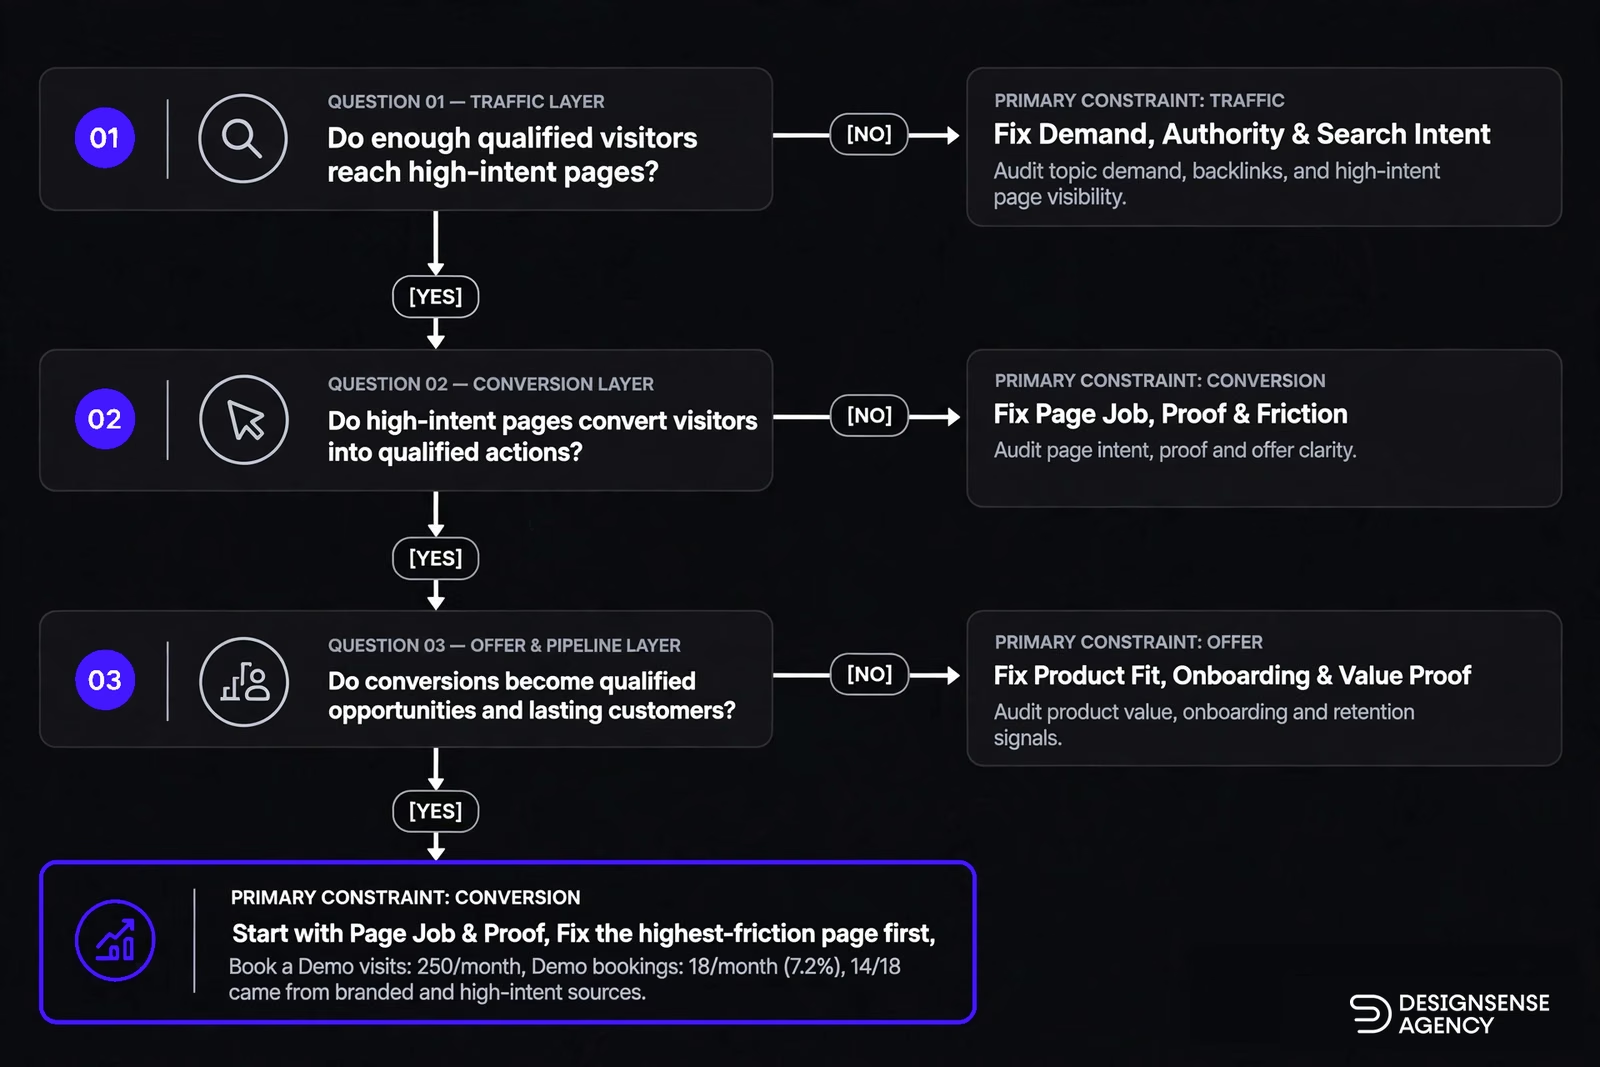
Step 1: Find the main constraint
Ask these three questions in order. Start with the first one that points to a likely constraint, then check the evidence before committing to a fix. This sequence is our synthesis of published diagnostics, not a named framework.
Each question draws on a method cited below.
1. Do enough qualified visitors reach your high-intent pages?
High-intent pages are those visitors use when they're closer to making a buying decision. These include pricing, demo and contact pages, product and solution pages, and comparison pages.
Total site traffic tells you little on its own. Visits to these pages show whether enough of the right people are reaching the part of the site designed to move them forward.
Estimate the traffic required to reach your goal. Divide the number of sales conversations you want each month by the current rate at which qualified visits to those pages become conversations.
Use a rate from comparable pages, audiences and conversion actions.
For example, you want 20 sales conversations a month and the pages nearest the sale turn 4% of visits into conversations. You need about 500 qualified visits.
If you get 250, you have a traffic problem, even though 4% may be a perfectly good conversion rate.
If you're short, check why.
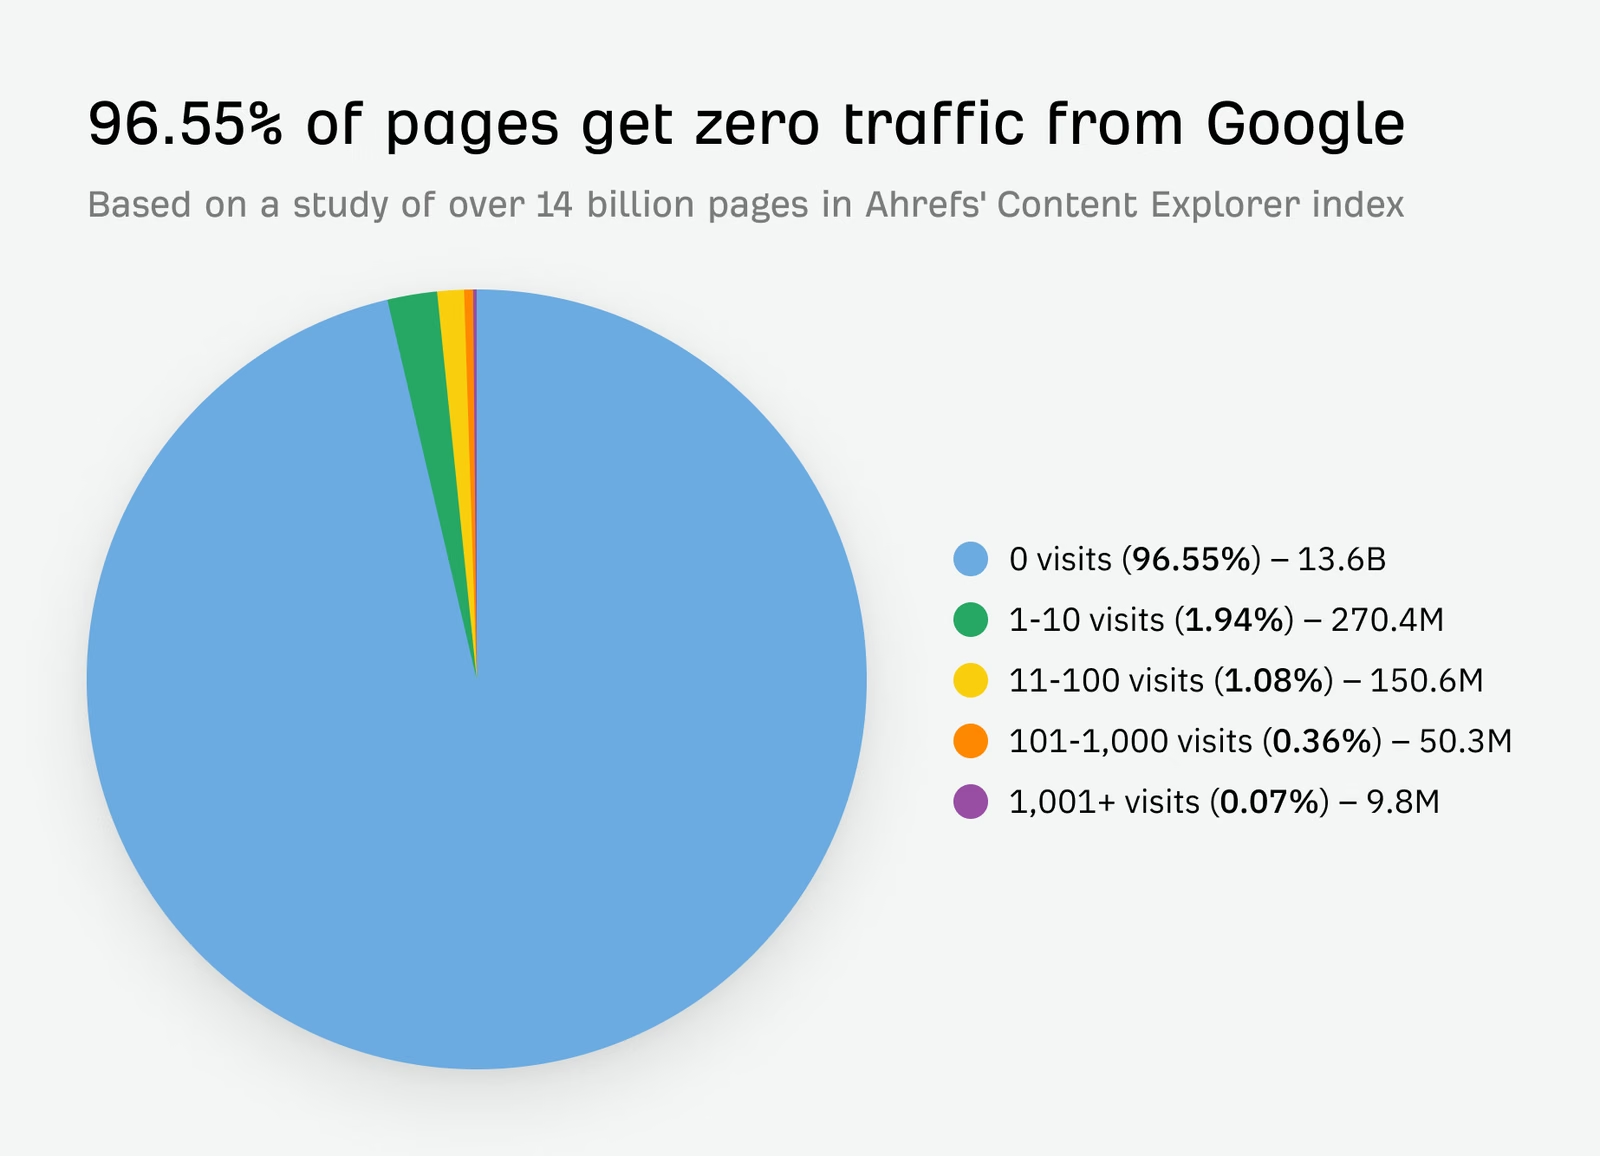
Ahrefs studied about 14 billion pages from its Content Explorer database and found that 96.55% get no traffic from Google.
The study names three common factors behind the gap.
Whether anyone searches for the topic, whether the page has backlinks (which correlate with traffic, though Ahrefs doesn't claim they cause it) and whether the page matches the intent behind the query.
Publishing more pages doesn't help if the topic, the authority or the intent is wrong.
Be careful how you define traffic, because clicks are shrinking.
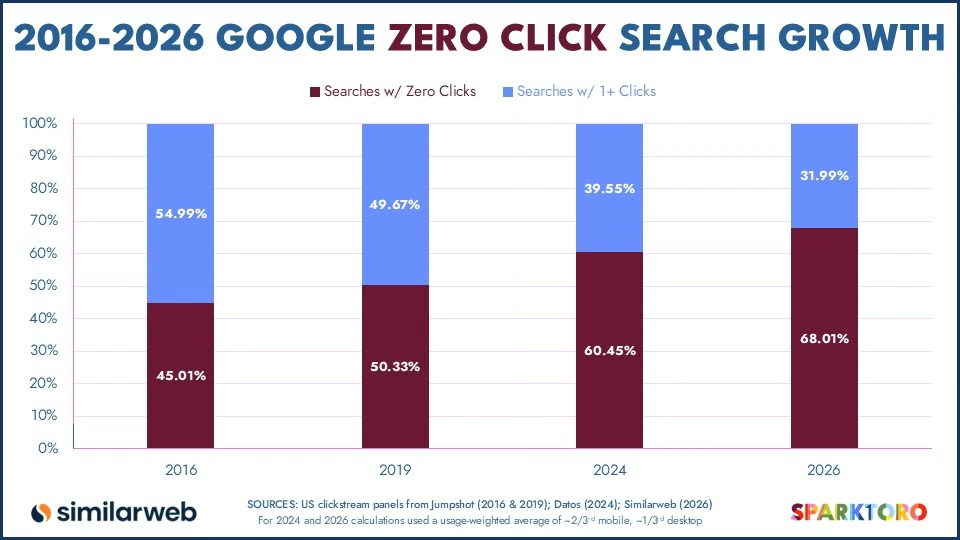
SparkToro’s 2026 study, based on Similarweb clickstream data, found that 68.01% of US Google searches from January through April 2026 ended without a website click, compared with 60.45% in 2024.
The two periods use different data panels, so the change is directional rather than a direct comparison.
This means fewer Google searches result in website visits. People can find answers directly in search results without visiting a website.
For B2B SaaS companies, this makes total website traffic a less complete measure of demand. Traffic can fall even when more people know your brand or become customers.
Instead, track visits to high-intent pages such as pricing, product and comparison pages. Also monitor branded searches and direct visits to understand whether people are looking for your company by name.
Total website visits still matter, but they don't tell you how many potential buyers you're reaching or how much demand your marketing is generating.
2. What’s Stopping Qualified Visitors From Converting?
Start by splitting the conversion rate on your high-intent pages by traffic source. The overall rate can hide what's actually going wrong.
If your demo page converts branded and direct visitors well but performs poorly with visitors from broad informational articles, the problem may be the traffic. Those visitors might not be ready for a sales conversation yet.
If conversion is low even among branded visitors, direct visitors and people comparing your product with competitors, investigate the page itself. Check whether the message, offer and next step give them a clear reason to act.
Don't assume the design is at fault.
The problem could be how you position the product, what you're offering or how you present it. Use the page as a starting point for investigation, not as proof of the cause.
The most useful lens is BJ Fogg's behavior model. Behavior happens only when motivation, ability and a prompt arrive together. When it doesn't happen, at least one is missing.
On a page, motivation is whether the message convinces, ability is whether the step is easy (form length, load time, a clear next action) and a prompt is whether there is a clear task at the moment the visitor is ready.
A second check is WiderFunnel's LIFT model. Anxiety and distraction pull conversion down even when the value proposition is clear.
For a fuller process, CXL's ResearchXL framework combines six sources of evidence. Technical analysis, heuristic analysis, web analytics, mouse tracking, qualitative surveys and user testing.
CXL's guide is explicit that a heuristic review is an educated opinion, which later research should confirm or reject. Treat your own audit the same way, as a list of hypotheses.
The goal is to find out why visitors aren't taking the next step before changing the page. Check whether the right people are arriving, whether the offer gives them a reason to act and whether anything makes that action difficult or risky.
Treat each finding as a hypothesis, then use analytics, user feedback and testing to confirm what's actually holding conversion back.
3. Do conversions lead to qualified opportunities and lasting customers?
If qualified visitors take the next step but demos rarely become opportunities, deals stall on the same objection or customers churn, look beyond the page.
The cause could be positioning, pricing, packaging, product fit, the sales process, onboarding or customer success.
A website cannot fix all of these. More traffic can simply send more people into the same problem.
Use different evidence for different failure points.
Lost-deal reasons and call recordings can reveal issues with positioning, pricing, fit or sales execution.
Cohort retention shows whether customers keep getting value after purchase. Brian Balfour's cohort model treats a retention curve that flattens as a candidate for product-market fit, because it shows a group of users finding lasting value.
For a B2B SaaS company, the practical version is revenue or logo retention by signup cohort.
One useful signal is demo-to-opportunity rate by source. If qualified demos stall at the same point across sources, review the offer and the sales process.
Repeated objections about price or fit may point to positioning, packaging or product fit.
Treat the pattern as directional because sales cycles, deal sizes, qualification criteria and sales execution vary. It is evidence to investigate, not proof that the offer alone is at fault.
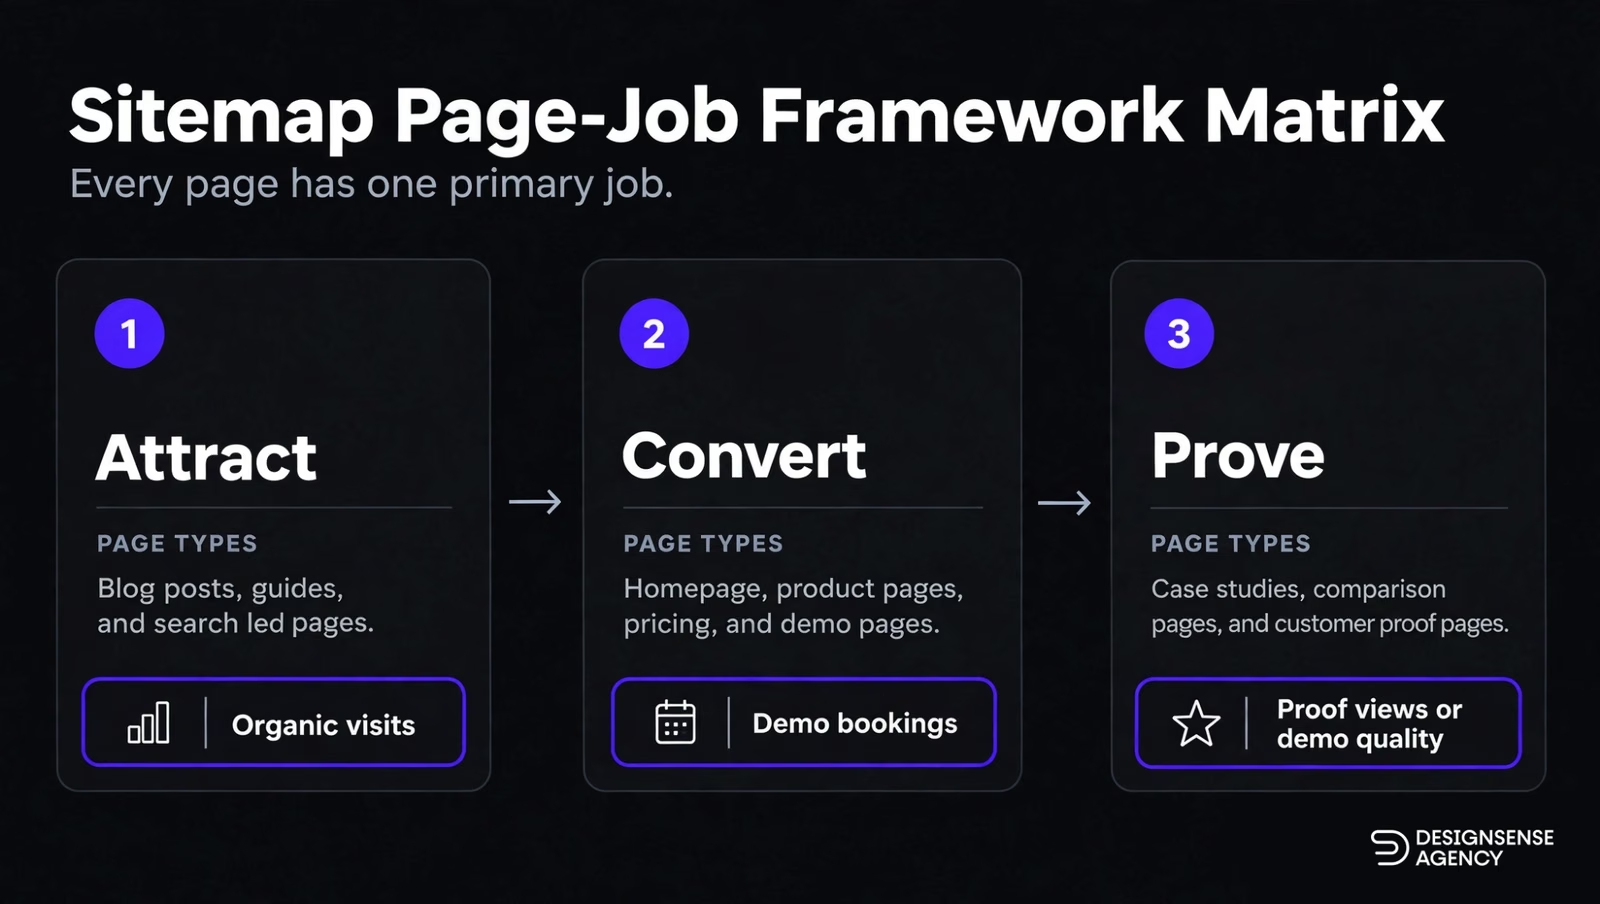
Step 2: Give every page one primary job
Before deciding what a page needs, be clear about what it’s there to do. Is it meant to attract the right people, help them weigh their options or get them to take action?
These three roles are a useful starting point for deciding what each page needs to do.
Attract: Earn a visit from someone who doesn't know you yet. Blog posts, integration pages and comparison pages that catch people searching for alternatives.
Convert: Ask visitors who are ready to take the next step to book a demo, start a trial or explore pricing and product details.
Prove: Remove doubt for people already considering you through customer stories, security and compliance pages, reviews and integration documentation.
Proof deserves its own job because of where buying decisions get made.
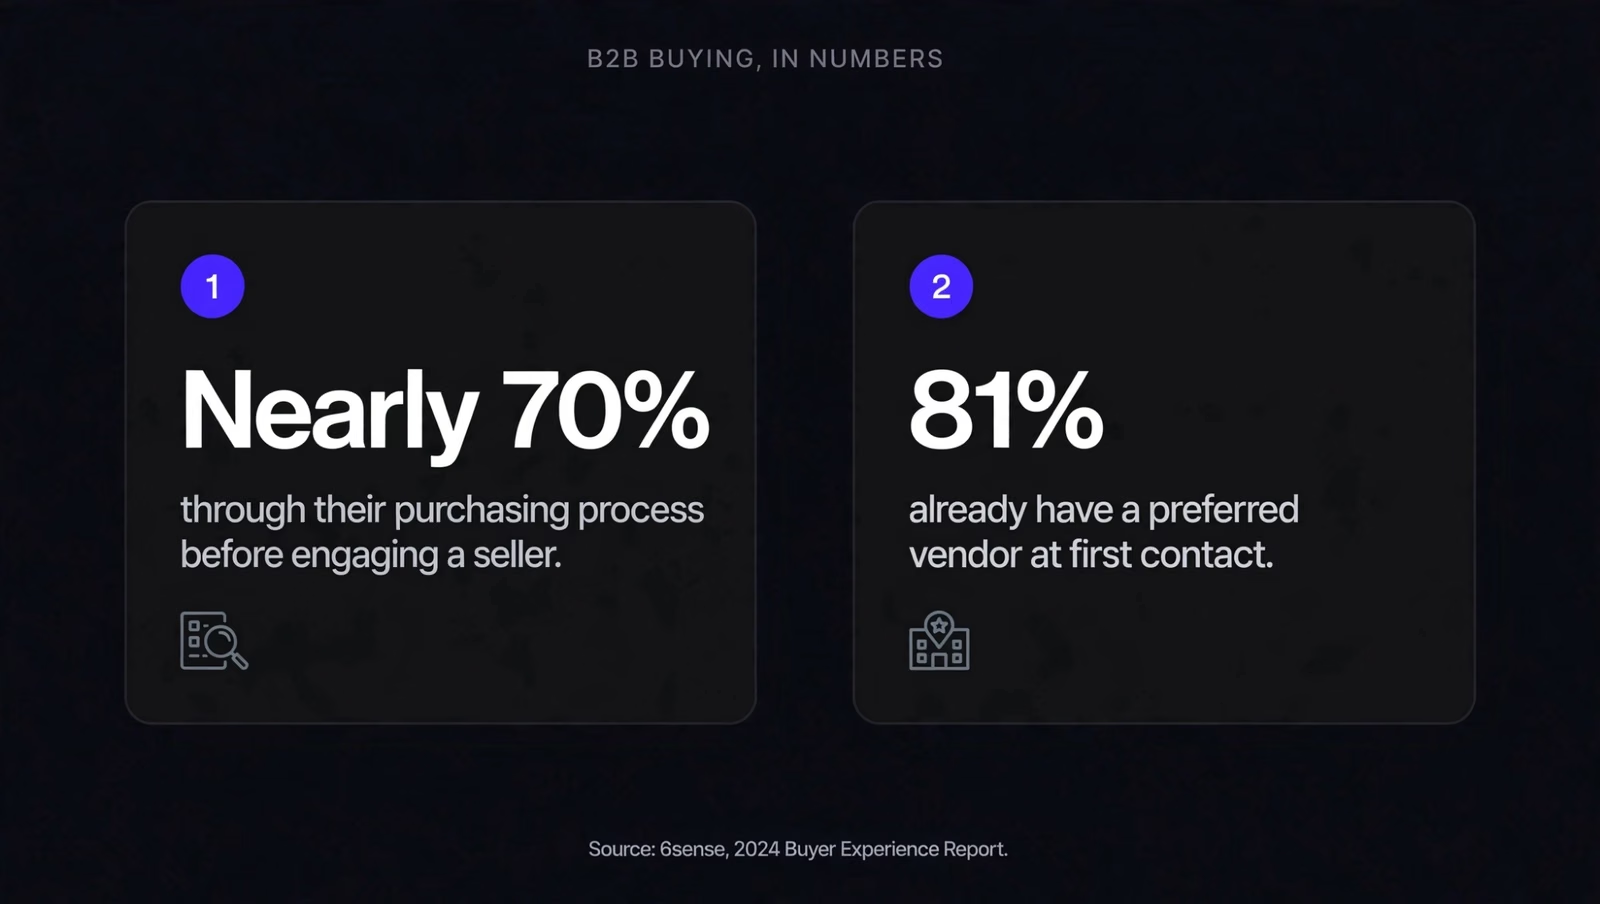
6sense's 2024 Buyer Experience Report found that buyers were nearly 70% through their purchasing process before engaging sellers and that 81% already had a preferred vendor at first contact.
6sense sells to B2B revenue teams and its release doesn't state the sample size or method, so treat the figures as directional.
Even so, they point to evaluation happening before anyone talks to sales and a pricing page without proof pushes that evaluation to places you don't control.
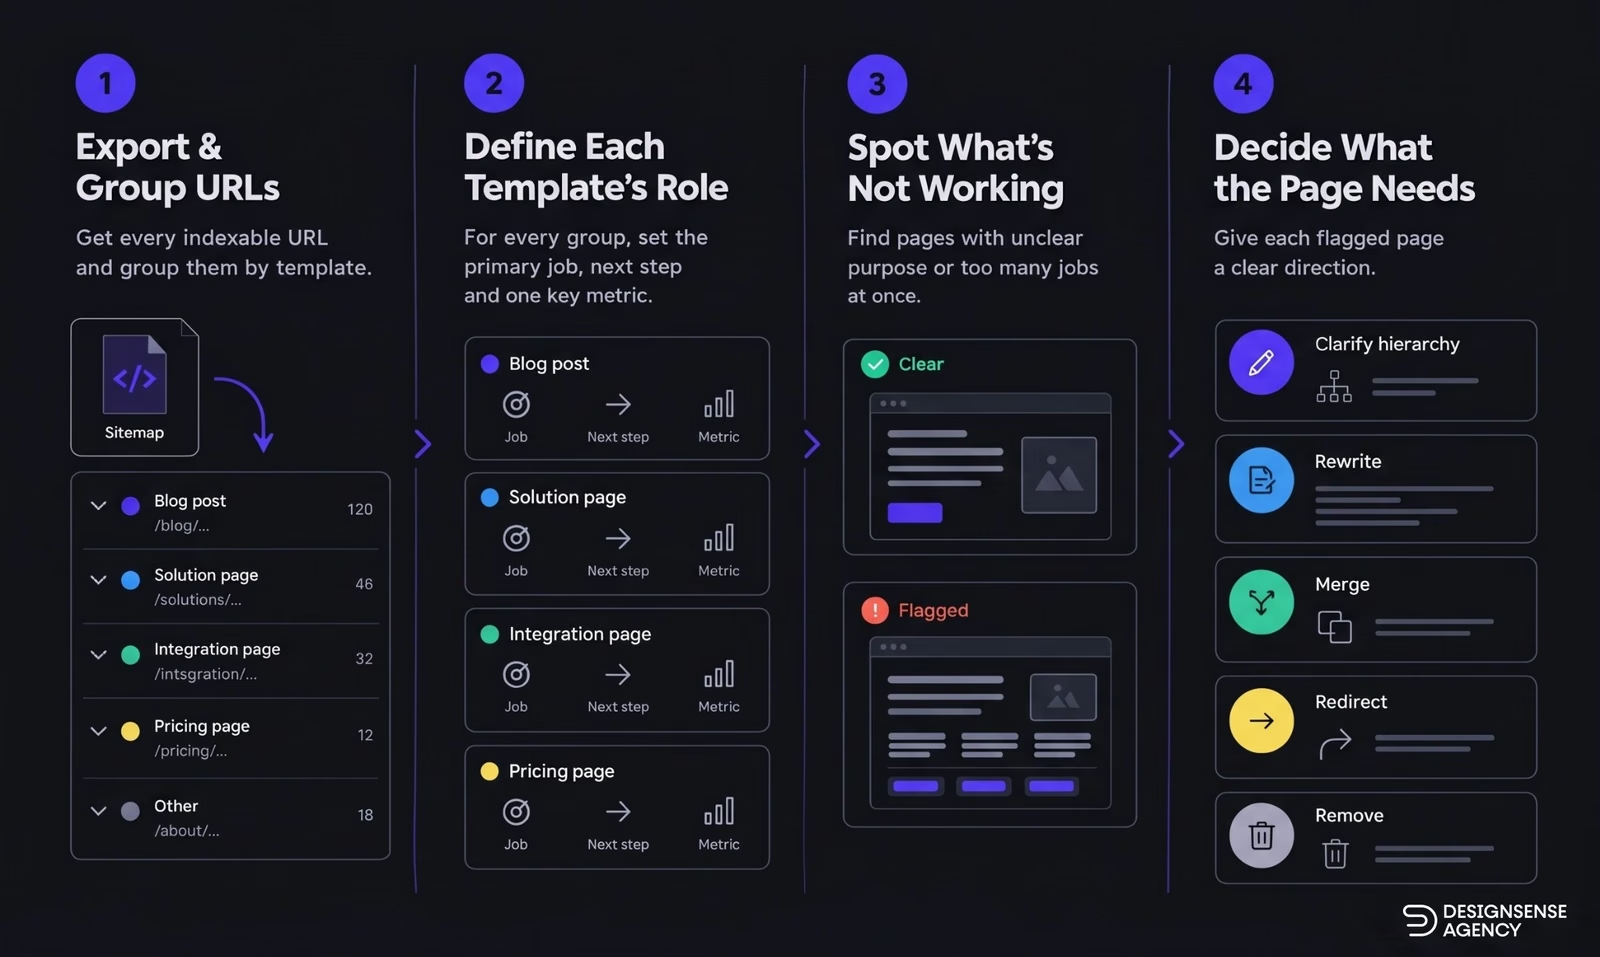
Run a sitemap audit
Export every indexable URL and group them by template. Blog post, solution page, integration page, and so on.
For each group, write down its primary job, the next step you want the visitor to take and one metric that shows whether the page is doing its job.
Flag pages whose primary job is unclear or that try to do too much without a clear hierarchy.
Decide what each flagged page needs. Clarify its hierarchy, rewrite it, merge it, redirect it or remove it.
The homepage is a common offender because it has to attract, convert and prove. It can support all three, but it still needs a clear primary path and a simple way for different visitors to find the page that fits their needs.
Step 3: Fix in the right order
Research can uncover dozens of problems, but there’s hardly enough time to fix them all. Peep Laja notes that conversion research can reveal 50 to 150 issues. The real work is figuring out which one to prioritize first.
A workable rule is to rank each fix by its likely impact, the strength of the evidence and the effort required.
Use the score to guide prioritization, not to create false precision.
Impact is how much pipeline sits behind the page and how much the change could move it.
Evidence is how many independent signals support the change. Analytics, recordings, sales-call notes, customer interviews. One opinion counts for little but three signals pointing at the same problem count for a lot.
Effort is the design, development and review time the change needs.
If your team argues over scores, CXL's PXL framework removes much of the debate by scoring most criteria as yes or no, such as whether the change is above the fold, noticeable within five seconds or backed by data.
Two ordering rules sit on top of the score.
Within a layer, start where intent is highest. Fix pricing, demo, product and comparison pages before the blog.
A visit to one of them is closer to revenue than a visit to a blog post and by the time buyers reach them, most already have a preferred vendor in mind (the 6sense figure above).
Across layers, address the clearest constraint before investing heavily in more volume above it.
If the evidence points to weak product fit or retention, more traffic can bring more customers into the same problem. If qualified visitors are not converting, more traffic may increase waste. This does not mean every other improvement must wait.
Some page fixes take days, while positioning or product changes may take quarters, so sequence the work without treating the layers as isolated.
Technical bugs and obvious errors don't need a test.
ResearchXL sorts findings into five buckets. Test, instrument, hypothesize, just do it and investigate.
Bugs and obvious fixes belong in “just do it”. Low-traffic sites also can't run A/B tests to a trustworthy result, so they should lean on qualitative evidence instead.
What comes out the bottom never feeds the top, so growth demands ever more input in the form of money, people and channels.
A loop is a closed system in which the output of one cycle becomes the input to the next.
An example is Pinterest. A user saves content, Pinterest reads the quality signals and distributes the content to search engines, a new user finds it and signs up, and the cycle restarts.
The fastest-growing products tend to run on one or two major loops, not a dozen weak ones.
A loop is not a guarantee that a channel will keep growing. It gives you a repeatable way to turn one result into the next input, rather than relying only on a fresh campaign each time.
The first banner ad, on HotWired in 1994, had a clickthrough rate of 78%. By 2011, the average banner clickthrough rate on Facebook was 0.05%, about 1,500 times lower.
Chen's explanation is that novelty fades, competitors copy what works and scale reaches less-qualified customers.
What a loop looks like on a B2B SaaS site
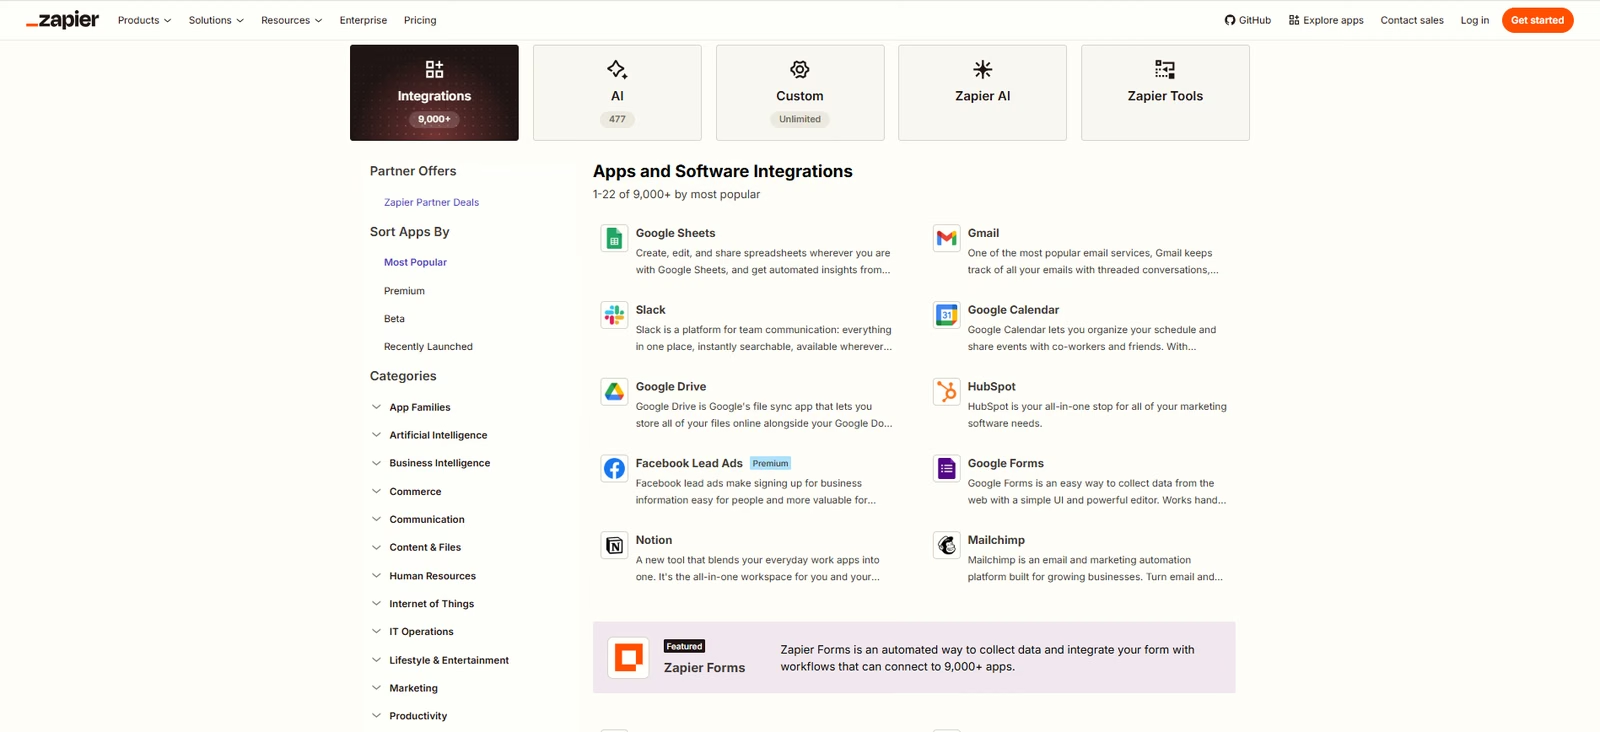
Zapier's app directory is a well-documented example of a site structured as a loop. Every app on the platform has its own page and Sacra's analysis reports that Zapier publishes landing pages automatically as new apps join.
Those pages draw search traffic, visitors discover integrations for the tools they already use, and some ask the vendors behind those tools to join Zapier, which adds more apps and more pages.
It rests on a large partner ecosystem, so most B2B SaaS companies can't copy it directly. The idea that carries over is that the pages come from something your product or customers already produce.
Hypothetical example of a smaller loop
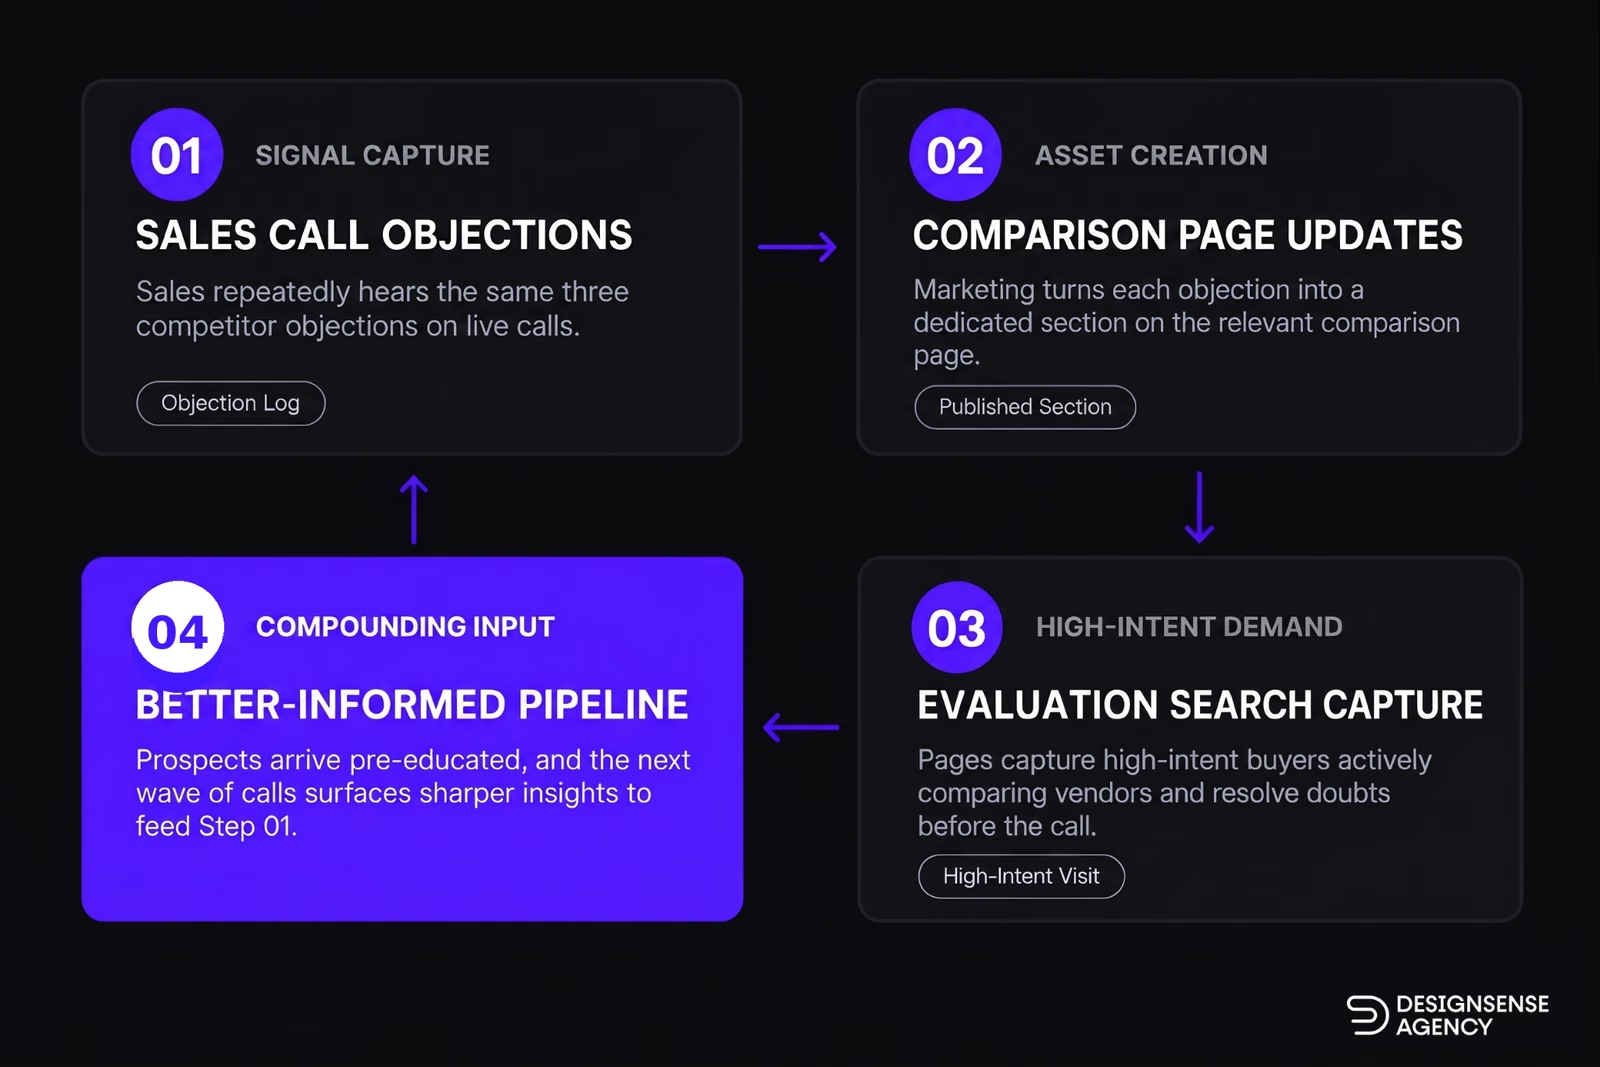
A sales team keeps hearing the same three objections about a competitor.
Marketing turns each one into a section on the relevant comparison page. Those pages catch evaluation searches and answer doubts before the call.
Prospects arrive better informed, and the next round of calls surfaces new objections to answer. The loop needs no scale, only a way for what sales hears to reach the site.
Why comparison pages can fit the loop
Comparison and alternatives pages can support this loop for two reasons. People searching for them are already evaluating, which is the category SparkToro says still earns clicks.
They also meet buyers who, per 6sense, often have a preferred vendor in mind.
Public data on how much better these pages convert than informational posts comes mostly from agencies, so this article does not quote a multiplier.
Measure your own results.
Who runs the system
This is an operating recommendation, not a universal rule. The right owner depends on team size, traffic, and how much cross-functional work the site needs.
The rough revenue bands below are a starting point, informed by Reforge's work on growth teams and Eli Schwartz's work on SEO, not fixed thresholds.
Under about $1M in annual recurring revenue (ARR), the founder runs the system. The founder usually has the most context on the buyer.
Traffic is often too low for A/B tests, so evidence comes from sales calls, session recordings and customer interviews.
Review the layer you're working on monthly, and re-run the three questions quarterly.
About $1M to $10M ARR, one named owner runs the system.
Give a head of marketing or product marketing accountability for the site as a system, with a designer or developer and standing input from sales.
A site that marketing can edit directly shortens the time between a finding and a fix. Check weekly for breakage and anomalies, run experiments monthly against the layer you're fixing and re-diagnose quarterly.
Above about $10M ARR, a cross-functional group runs the system.
Reforge argues that loops cut across functions, so every function needs to work toward the same loop output instead of its own funnel metric.
Schwartz goes further for search. In a 2021 Built in interview, he argues SEO teams belong in product, not marketing. Keep the weekly and monthly cadence, and add a quarterly review of how each loop is performing.
Pair every primary measure with a quality check or the number drifts toward whatever is easiest to inflate. A form that converts twice as well is no gain if sales rejects most of what it sends.
Where to start
Start with three actions.
First, run the diagnostic and write down the strongest constraint, along with the evidence behind it.
Second, audit the sitemap and give each page a primary job.
Third, choose the highest-priority fix based on impact, evidence and effort.
It may be a pricing or demo page, but let the diagnosis decide. Measure the result and repeat the process next quarter.
FAQ
How do I know if my website has a traffic problem or a conversion problem?
Compare qualified visits to high-intent pages with the number you need. If the pages do not get enough of the right visitors, investigate demand and acquisition. If enough qualified visitors arrive but do not act, inspect the page, message and offer. Segment by source before deciding.
How long does a B2B website growth strategy take to show results?
Changes to pages that already receive enough qualified traffic may show up in conversion data first. Pipeline and revenue take longer. 6sense's 2024 survey put the average B2B buying cycle at 11.3 months. Organic search can take longer still. Ahrefs found that the average page in first position is about five years old, and that only 13.7% of top-10 pages were under a year old. Those figures describe the age of pages holding those positions, not how long each page took to rank. Track leading indicators first, then pipeline and revenue as the evidence accumulates.
Should I redesign my website or fix the current one?
Diagnose the constraint first. A redesign will not create search demand or fix a weak offer. Consider it when the site structure, platform or brand prevents you from making the changes the business needs. Even then, start with the highest-intent pages, measure the result and expand from there.